
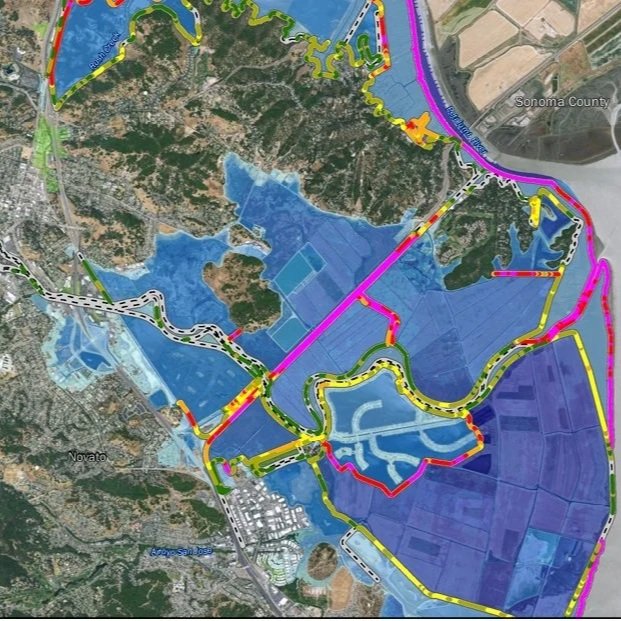
Blue areas show where water is expected to cover the land in a future storm with higher sea level. Lighter blue means shallower flooding and darker blue means deeper water. Green areas are higher ground that stays dry in this scenario.higher water level equivalent to about 5.5 feet of sea level rise and/or a larger storm tide.Rising Tides, Sinking Ground: Sea Level Rise, Flood Risk, and Infrastructure Finance from the Bay Area to Bel Marin Keys
Contents
- Executive Summary
- The Science: Sea Level Rise Is Accelerating
- The Bay Area Crisis
- Marin County: Ground Zero for Compound Risk
- The Novato Watershed: Where Risk Converges
- Bel Marin Keys: The Canary in the Coal Mine
- The Cost Spiral: Insurance, Property Values, and Tax Base Erosion
- The Financing Solution: Enhanced Infrastructure Financing Districts
- The West Sacramento Precedent
- A Proposed Pilot: The BMK Resilience EIFD
- Recommendations
Executive Summary
Sea level rise is no longer a projection confined to end-of-century disaster scenarios. It is a present-tense fiscal and infrastructure emergency reshaping the balance sheets of municipalities, the actuarial tables of insurers, and the economic calculus of coastal property ownership across California. In the San Francisco Bay Area, where more than 400,000 residents and an estimated $150 billion in property sit within the reach of coastal flooding, the collision of rising oceans, sinking land, aging levee infrastructure, and a rapidly contracting insurance market has created a compound risk unlike anything California's local governments have faced before.1
The region confronts an adaptation financing gap of historic proportions. Protecting the entire Bay Area shoreline through 2050 will cost an estimated $110 billion at the median; existing public revenue streams will supply roughly $5.5 billion of that sum, leaving a gap approaching $105 billion.2 The cost of inaction is higher still, exceeding $230 billion in partial estimates that do not capture the full cascade of economic damage. Against this backdrop, the tools and institutions of coastal governance -- FEMA flood maps, NFIP premiums, county flood control districts, state coastal planning mandates -- were designed for a different climate era. They are straining, and in some cases breaking, under conditions they were never built to handle.
Nowhere is this institutional mismatch more legible than in Marin County, and nowhere in Marin more acutely than at Bel Marin Keys (BMK), a 702-parcel waterfront community situated on former tidal marsh in unincorporated Novato. Every parcel at BMK sits within FEMA's Special Flood Hazard Area Zone AE. The community's sole protection from tidal inundation is an aging levee system and two navigational lock structures, one of which was visibly failing as recently as January 2024. The Bel Marin Keys Community Services District (BMKCSD) -- the small special district that maintains this critical infrastructure -- ran a net operating deficit of nearly $2 million in fiscal year 2023-24, even after voters approved a $1,800 per-parcel annual assessment in March 2024. The north lock reconstruction alone will cost $4.5 million: nearly two full years of the district's total revenue.
This paper argues that the Bel Marin Keys situation is not merely a local infrastructure problem. It is a prototype of the compound risk facing dozens of low-lying Bay Area communities, and it is precisely the kind of challenge for which California has a largely untested but highly promising financing tool: the Enhanced Infrastructure Financing District (EIFD). EIFDs allow local governments to capture property tax increment generated within a defined geography and pledge it against long-term bonds -- without raising taxes and without a voter approval threshold for bond issuance. Used properly, an EIFD at Bel Marin Keys could unlock $20 to $40 million in bonding capacity for levee reconstruction, lock replacement, and habitat integration, all financed from the very increases in assessed value that resilient infrastructure would help protect and generate.
The West Sacramento Community Facilities District EIFD issued $57.225 million in Tax Increment Bonds in July 2025, becoming the first EIFD in California to complete a bond issuance.3 That precedent matters. It demonstrates that the legal and financial architecture is sound, that capital markets will engage, and that patient, multi-year district formation and assessed value cultivation can produce meaningful bonding capacity. West Sacramento's experience offers a detailed operational template that Marin County can adapt. The path is not easy -- district formation takes years, not months -- but the urgency of BMK's infrastructure condition means that process should begin now.
This white paper proceeds in three movements. The first (Sections II through VI) documents the physical and economic reality of sea level rise from the global scale down to the individual parcel, with particular attention to the acceleration of the science, the Bay Area's unique vulnerability, and Bel Marin Keys' specific exposure. The second movement (Section VII) examines the cost spiral now underway in insurance markets and its downstream effects on property values, mortgage availability, and local government tax revenue. The third movement (Sections VIII through XI) presents the EIFD financing solution, the West Sacramento precedent, a detailed proposed structure for the BMK Resilience EIFD, and a specific set of recommendations for the County of Marin, the BMKCSD, and the California Legislature.
Sources
- Maven's Notebook, "Knee Deep Times: New Study Teases Out Seawall Impacts" (2026). https://mavensnotebook.com/2026/01/13/knee-deep-times-new-study-teases-out-seawall-impacts/
- MTC/ABAG/BCDC, Sea Level Rise Adaptation Funding and Investment Framework (2023). https://mtc.ca.gov/sites/default/files/documents/2023-07/SLR_Framework_Final_Report.pdf
- City of West Sacramento EIFD, Tax Increment Bond issuance, July 10, 2025. See also West Sacramento EIFD reporting, 2025.
The Science: Sea Level Rise Is Accelerating
The scientific record of sea level rise at San Francisco Bay begins with the Presidio tide gauge, one of the longest continuous tidal records on the West Coast. That gauge documents approximately eight to ten inches of relative sea level rise since 1900 -- a rise that occurred at a historical average rate of roughly two millimeters per year for much of the twentieth century.1 The pace was slow enough that infrastructure built in the mid-twentieth century could reasonably ignore it. That era is over. The rate of global sea level rise has more than doubled since satellite measurements began in 1993, and the scientific community's central finding is stark: the Bay Area will experience as much sea level rise in the next thirty years as it did over the prior hundred.
The physical drivers of this acceleration are multiple and reinforcing. Thermal expansion -- the increase in ocean volume as seawater absorbs atmospheric heat -- is now the single largest contributor, accounting for approximately 56 percent of total global mean sea level rise, according to a 2025 analysis published in the journal Progress in Oceanography.2 Ocean heat content rose 1.7 times faster in the past decade than in previous decades, meaning the thermal expansion contribution is itself accelerating. The second major driver, glacier mass loss, is now accelerating at an equally alarming rate. Glaciers worldwide are losing an average of 273 billion tonnes of ice per year, and that annual loss increased 36 percent between the first half of the study period (2000 to 2011) and the second half (2012 to 2023), rising from 231 billion to 314 billion tonnes per year.3 Glaciers have contributed 18 millimeters to global sea level rise since 2000 and are now the second-largest contributor after thermal expansion.
The great ice sheets of Greenland and Antarctica introduce a separate tier of risk -- lower probability but potentially catastrophic magnitude. The Greenland Ice Sheet is responsible for approximately 20 percent of current observed sea level rise and contains enough ice to raise global sea levels by 23 feet if fully melted.4 The IPCC projects a Greenland contribution of between 3.1 and 10.6 inches by 2100 under a high-emissions pathway. The West Antarctic Ice Sheet introduces a further 1.2 to 11 inches of potential rise by the same date, and crucially, the geometry of ice loss in West Antarctica causes disproportionately elevated sea level rise along the California coast: a one-foot global average rise from West Antarctic melt translates to approximately 1.25 feet of rise in California due to gravitational and rotational effects.5
California's authoritative sea level rise projections come from the Ocean Protection Council (OPC), whose 2024 Science and Policy Update represents the current state of official guidance. The OPC's Intermediate-High scenario projects 3.0 feet of rise by 2080 and 4.9 feet by 2100 relative to 2000 baseline conditions. The High scenario reaches 4.1 feet by 2080 and 6.6 feet by 2100. Perhaps most consequentially for planning purposes, the OPC cannot rule out an extreme scenario of 11.9 feet by 2150, a possibility that fundamentally changes the engineering calculus for infrastructure with 50-year design lives. Under extreme H++ scenarios, the rate of rise could reach 50 millimeters per year by the end of the century -- 30 to 40 times the rate experienced during the twentieth century. NOAA's Intermediate scenario for San Francisco specifically projects 0.8 feet of rise by 2050, already a meaningful increment for infrastructure operating at the margin of flood tolerance.
A dimension of the sea level rise problem specific to the Bay Area -- and one that standard planning projections systematically underestimate -- is land subsidence. Many of the Bay Area's most developed waterfront areas were built on engineered fill placed atop former bay mudflats and tidal marshlands. That fill compacts over time. The result is that the ground is sinking even as the water is rising, creating what scientists call "relative sea level rise" that combines both effects. A NASA analysis published in early 2026, using satellite-based measurements of vertical land motion from 2015 to 2023, found that land subsidence in the Bay Area could cause effective sea level rise to exceed double the ocean-rise projections alone by 2050 in some locations.6 Areas built on fill -- including Bel Marin Keys, San Francisco's Mission Bay, Treasure Island, and the Embarcadero -- are specifically identified as most exposed to this compounding effect. The December 2024 Regional Shoreline Adaptation Plan adopted by the Bay Conservation and Development Commission (BCDC) acknowledged this dynamic by, for the first time, requiring that all local adaptation plans consider how sea level rise will push up groundwater tables beneath the fill, not only overtop levees from the bay side.
The frequency of flooding events is changing as well as the eventual extent. What scientists classify as "minor" high-tide flooding -- nuisance flooding that blocks roads and disrupts daily life without constituting a disaster -- currently occurs approximately three times per year along Bay Area bay shores. NOAA projects that this frequency will rise to ten or more events per year by 2050 under intermediate scenarios. This chronic flooding regime is distinct from the catastrophic inundation scenarios that dominate public discourse, and in some respects it is more financially damaging: it impairs property access repeatedly, imposes recurring repair costs, raises insurance claims frequency, and imposes invisible costs on commuters, businesses, and emergency responders that do not appear in disaster declarations but accumulate relentlessly in community balance sheets.
Sources
- City and County of San Francisco, Sea Level Rise Guidance 2025. https://onesanfrancisco.org/sites/default/files/inline-files/2025_San_Francisco_SLR_Guidance_0.pdf
- Science Direct / Progress in Oceanography (2025), thermal expansion analysis. https://www.sciencedirect.com/science/article/pii/S1385110125000280
- DLR German Aerospace Center, "Glacial Melting Increases Freshwater Loss and Accelerates Sea Level Rise" (2025). https://www.dlr.de/en/latest/news/2025/glacial-melting-increases-freshwater-loss-and-accelerates-sea-level-rise
- Belfer Center for Science and International Affairs, "Greenland Ice Sheet, Sea Level Rise and Coastal Communities." https://www.belfercenter.org/research-analysis/greenland-ice-sheet-sea-level-rise-and-coastal-communities
- California Water Library, "Rising Seas in California: An Update on Sea Level Rise Science." https://cawaterlibrary.net/document/rising-seas-in-california-an-update-on-sea-level-rise-science/
- ABC7 News, "San Francisco is Sinking at Rapid Pace Due to Sea Level Rise, NASA Data Shows." https://abc7news.com/post/san-francisco-is-sinking-rapid-pace-due-sea-level-rise-nasa-data-shows/18730957/
The Bay Area Crisis
The San Francisco Bay occupies a peculiar and alarming position in the national sea level rise calculus. Though it represents approximately one-third of California's total coastline, it will absorb roughly two-thirds of the state's total economic damage from sea level rise -- a concentration of risk that reflects the extraordinary density of people, capital, and infrastructure packed around a single shallow tidal estuary.1 More than eight million residents live in the nine counties and 101 cities of the Bay Area, and a disproportionate share of the region's economic activity -- corporate campuses, freight terminals, wastewater treatment plants, power substations, highways, and airports -- sits at or near bay level. This is not an accident of geography but a consequence of a century of deliberate development that treated the bay margin as premium industrial and residential land rather than as the tidal buffer zone it once was.
The scale of financial exposure is staggering and has been quantified with increasing precision over the past several years. The Metropolitan Transportation Commission (MTC), the Association of Bay Area Governments (ABAG), and the BCDC jointly produced a Sea Level Rise Adaptation Funding and Investment Framework in 2023 that estimated the cost of protecting all portions of the Bay Area shoreline from sea level rise and storm surge through 2050 at $110 billion at the median, with a range from $81 billion to $147 billion depending on sea level rise realization.2 The updated Plan Bay Area 2050+ projection places the shoreline adaptation cost at $96 billion. Against that need, existing and reasonably foreseeable revenue streams through 2050 -- including state bonds, federal programs, local taxes, and special district assessments -- are projected to supply only approximately $5.5 billion. The resulting funding gap of roughly $105 billion is not a rounding error. It represents a structural failure of governance to match the fiscal instruments available to local government against the scale of the physical challenge those governments face. The cost of doing nothing is even larger: the MTC framework estimates that inaction will cost the region over $230 billion, a figure that itself represents only a partial accounting of the full economic damage cascade.
The human dimensions of this risk are equally concrete. Some 400,000 Bay Area residents live in areas at risk of coastal flooding, along with 104,000 existing jobs and 85,000 planned jobs that could be displaced or disrupted by flooding or the infrastructure loss it causes.3 Approximately 13,000 existing housing units and 70,000 planned new housing units are directly threatened, representing an acute intersection between the region's coastal flooding exposure and its already severe housing shortage. The Plan Bay Area 2050 analysis found that a comprehensive adaptation strategy could prevent up to 98 percent of the region's planned 2050 housing from inundation, protecting up to 200,000 homes -- but only if that strategy is funded and executed, a condition nowhere near being met. The communities most exposed to these risks are disproportionately low-income. San Rafael's Canal District, the most vulnerable community to sea level rise in the entire Bay Area, is home to 12,000 people, is Marin's densest neighborhood, and is predominantly composed of low-income Latino residents whose options for relocation or self-insurance are severely constrained.
The Bay Area's key infrastructure tells its own story of exposure. Both major regional airports -- San Francisco International (SFO) and Oakland International -- occupy landfill sites at bay level. SFO's exposure has been studied extensively; under a high sea level rise scenario, portions of the airport could face regular tidal inundation within decades. The Bay's ports, freight rail lines, and wastewater treatment plants were similarly sited on bay margins for operational reasons that made sense in a pre-climate-change planning era. The region's highway network is threaded through tidal corridors: State Route 37 between Vallejo and Novato -- the critical east-west link connecting the North Bay to the rest of the region -- was built across the edge of San Pablo Bay and faces increasing flood frequency under every sea level rise scenario analyzed by Caltrans. SMART rail, the commuter rail system serving Sonoma and Marin counties, runs parallel to SR-37 through one of the most flood-vulnerable corridors in the state. Protecting this infrastructure, or replacing it with elevated alternatives, is a multi-billion-dollar challenge that sits on top of the residential and commercial shoreline protection costs already described.
The governance response has begun to organize itself, though it remains far behind the pace of the physical threat. On December 5, 2024, the BCDC unanimously adopted the Regional Shoreline Adaptation Plan (RSAP) -- the first regional sea level rise plan in Bay Area history, adopted pursuant to SB 272.4 The RSAP establishes a framework for coordinated shoreline adaptation across the nine-county region and requires all local governments along the bay shoreline to submit Subregional Shoreline Adaptation Plans to BCDC by January 1, 2034. This is meaningful progress, but as of early 2026, no Bay Area city had submitted a final subregional plan, and the planning deadline of 2034 leaves a decade-long window during which infrastructure investment decisions will be made without the benefit of integrated plans. The federal response has been similarly ambivalent: the Water Resources Development Act of 2024, signed by President Biden, instructed the Army Corps of Engineers to study sea level rise adaptation for the entire Bay Area, with the study anticipated to begin in 2026.5 Simultaneously, however, the Trump administration blocked $13.5 million in previously committed funding for flooding prevention infrastructure at Marin City and $18 million for levee strengthening in San Rafael, signaling that federal support for Bay Area resilience cannot be relied upon as a stable planning assumption.
| County | Adaptation Cost (2050) | Key Exposed Assets |
|---|---|---|
| Alameda | $22 billion | Oakland Airport, Port of Oakland, waterfront neighborhoods |
| Marin | $17 billion | Canal District, Bel Marin Keys, Highway 37, Stinson Beach |
| San Mateo | ~$12 billion (est.) | SFO, Foster City, Redwood City waterfront |
| Santa Clara | ~$10 billion (est.) | South Bay shoreline, Alviso, tech campuses |
| Region Total | $96-$110 billion | 9 counties, 101 cities, 8M+ residents |
Sources
- KQED, "Bay Area Now Has First-Ever Regional Sea Level Rise Plan" (December 2024). https://www.kqed.org/news/12016813/bay-area-now-has-first-ever-regional-sea-level-rise-plan
- MTC/ABAG/BCDC, Sea Level Rise Adaptation Funding and Investment Framework, Final Report (July 2023). https://mtc.ca.gov/sites/default/files/documents/2023-07/SLR_Framework_Final_Report.pdf
- Joint Venture Silicon Valley, "Sea Level Rise and the San Francisco Bay Area: A Regional Approach to Adaptation." https://jointventure.org/blog/2695-sea-level-rise-and-the-san-francisco-bay-area-a-regional-approach-to-adaptation
- KQED, "Bay Area Now Has First-Ever Regional Sea Level Rise Plan" (December 2024). https://www.kqed.org/news/12016813/bay-area-now-has-first-ever-regional-sea-level-rise-plan
- California State Coastal Conservancy press release, "San Francisco Bay Sea Level Rise Study Included in WRDA 2024" (January 7, 2025). https://scc.ca.gov/2025/01/07/press-release-san-francisco-bay-sea-level-rise-study-included-in-water-resources-development-act-of-2024-wrda/
Marin County: Ground Zero for Compound Risk
Marin County occupies a particular position in the Bay Area's sea level rise geography. With 70 miles of Pacific coastline and 40 miles of bay shore, the county faces exposure from two different bodies of water, each presenting distinct hazard profiles.1 The Pacific coast brings wave energy and episodic storm surge to communities like Stinson Beach and Bolinas; the bay shore delivers the chronic, incremental inundation of tidal creep combined with the compound flooding that occurs when multiple water sources converge simultaneously. The county's steep terrain -- the ridges of Mount Tamalpais and the hills of the rural west -- means that development has naturally concentrated in the flatter, lower-lying areas of the county: the valleys and bay-edge flatlands that were also, in most cases, the areas originally occupied by tidal marsh. Those former marshlands were filled and developed through the mid-twentieth century, and the fill on which those communities sit is now consolidating and subsiding under the weight of decades of development.
The price tag for protecting Marin County from the approximately two feet of sea level rise projected toward the end of the century is $17 billion -- the second-highest adaptation cost of any Bay Area county, behind Alameda County's $22 billion estimate.2 Spread across Marin's approximately 260,000 residents, that figure represents roughly $65,000 per county resident -- an extraordinary burden even for a wealthy county. The number becomes more alarming when considered in the context of what Marin actually has available: a proportional share of California's Proposition 4 climate bond (a $1.2 billion coastal resilience allocation for the entire Bay Area), intermittent State Coastal Conservancy grants, the $25 million per year generated by the nine-county Measure AA parcel tax, and the county's own limited general fund resources. The arithmetic is not close. The gap between Marin's adaptation cost and its available revenue is measured in the tens of billions.
The communities most vulnerable to sea level rise within Marin range from affluent beach towns to densely populated low-income neighborhoods, and the political and financial dynamics of their situations differ dramatically. San Rafael's Canal District is broadly recognized as the single most vulnerable community to sea level rise in the entire Bay Area. Home to approximately 12,000 people in Marin's densest neighborhood -- predominantly a low-income Latino community -- parts of the Canal District already sit at elevations below mean high tide, protected only by aging infrastructure. The community's vulnerability has been documented extensively by Canal Alliance, which has observed that the neighborhood faces a "right now problem": its residents are already experiencing flooding that damages homes, disrupts businesses, and imposes health risks, not a future scenario but a present reality that intensifies with each storm season.3 At the other end of the economic spectrum, Stinson Beach -- a community of oceanfront vacation homes and primary residences with aggregate property values in the billions -- faces a different kind of crisis. The road serving the community (Calle del Arroyo) is already impassable during king tides, and the estimated cost of shoreline protection for Stinson Beach alone is $1.2 billion. The Seadrift Association has threatened "billions in liability" against the county if the road is abandoned to flooding.
Marin's transportation network is critically exposed at multiple points. A Transportation Authority of Marin and Arup study released in May 2025 identified the county's most vulnerable roadways, including the Highway 101/580 interchange at San Rafael, the Lucky Drive exit to Highway 101 at Larkspur (which already floods during king tides), Highway 37, and Highway 1 along the coast.4 Highway 37 deserves particular attention as a regional connectivity issue: it is the only road connecting the North Bay to the rest of the region via the south, and Caltrans has estimated the cost of a comprehensive SR-37 improvement at $500 million across three project phases -- with a long-term comprehensive vision that exceeds $10 billion and remains largely unfunded. The California Transportation Commission approved $73 million in SB 1 funding for the project, with Phase 2 design completion targeted for late 2026 and construction beginning in 2029 at the earliest. Critics have noted that even a fully rebuilt Highway 37, constructed to current standards, could face increasing flooding frequency within fifteen years of completion under higher sea level rise scenarios -- raising the question of whether the project should be designed to a more ambitious standard than current funding levels allow.
The events of January 2026 illustrated, with damaging clarity, what compound flooding looks like in practice. A combination of king tides and winter storms drove significant flooding across Marin, damaging an aging levee in San Rafael that will cost an estimated $25 million to repair. The events also exposed the fragility of the institutional funding landscape: the Trump administration's simultaneous blocking of $13.5 million in previously approved funding for a Marin City Highway 101 flood-prevention exit and $18 million for San Rafael levee strengthening sent an unambiguous signal that communities depending on federal infrastructure investment for coastal resilience face substantial political risk. Against that backdrop, California-based financing tools -- those that do not depend on federal appropriations or executive branch discretion -- take on heightened strategic importance. The EIFD structure, authorized under California law and funded from local tax increment, is precisely such a tool.
"Marin County faces an estimated $17 billion adaptation cost -- roughly $65,000 per resident -- against available revenue streams that cover only a small fraction of that need. The January 2026 federal funding blocks make self-reliant financing tools not merely preferable but essential."
Sources
- San Francisco Chronicle, "Marin Flood and Sea Level Rise" (January 2026). https://www.sfchronicle.com/climate/article/marin-flood-sea-level-rise-21279770.php
- North Bay Business Journal, "Marin Grapples with High Cost of Sea Level Rise" (October 2023). https://www.northbaybiz.com/2023/10/31/marin-grapples-with-high-cost-of-sea-level-rise/
- Canal Alliance, "The Bay Area Neighborhood Most Vulnerable to Sea Level Rise Is Also Sinking." https://www.canalalliance.org/blog/news/the-bay-area-neighborhood-most-vulnerable-to-sea-level-rise-is-also-sinking-a-right-now-problem/
- Arup / Transportation Authority of Marin, "Sea Level Rise Impacts on Marin County Transportation Network" (July 2025). https://www.arup.com/news/july-2025-transportation-authority-of-marin-and-arup-unveil-new-study-addressing-impacts-of-sea-level-rise-on-marin-countys-transportation-network/
The Novato Watershed: Where Risk Converges
The Novato Creek watershed occupies a special place in Marin County's flood risk geography. Covering 44 square miles, it is the largest watershed in eastern Marin County, and it drains a catchment that combines the steep, impervious hills above Novato with the low-lying bay-edge flatlands through which the creek's lower reach winds toward San Pablo Bay.1 The combination is hydrologically volatile: rain that falls on the hills moves quickly into the channel, while the flat lower watershed has limited capacity to convey that water through to the bay before the next tide pushes back. This bidirectional pressure -- storm runoff from above, tidal inundation from below -- is the defining characteristic of the Novato Creek flood problem. Over the past 150 years, the watershed has recorded 25 documented flood events, with 15 classified as Very Severe or Severe, a recurrence frequency that makes it one of the most flood-prone watersheds in the Bay Area.
Human intervention has made the problem worse. The historical reclamation of tidal marshlands throughout the Novato Creek lower watershed over the past century and a half eliminated natural floodplain storage and tidal buffer capacity. The creek's channel was narrowed and progressively aggraded with sediment as the tidal forces that once scoured it were reduced. The Marin County Flood Control and Water Conservation District began a 20-year channel improvement program in 1985 with the goal of achieving 50-year flood protection levels. That program was not fully successful: by the assessment of the district's own engineering consultants (KHE, 2016), Novato Creek today operates above its maximum in-channel conveyance capacity and does not meet the 50-year flood protection design standard it was built to achieve. Maintenance dredging is required every four years at an annual cost of $250,000 funded by the Zone 1 parcel tax -- and even that maintenance budget is straining under rising dredging costs and the gradual realization that the channel is losing capacity faster than current maintenance spending can offset.
The most recent major flood event in the watershed occurred in 2014, when storm flows damaged flood protection levees, caused widespread flooding across Novato, and closed both surface streets and Highway 37. That event -- which occurred under current sea level conditions -- illustrates the baseline vulnerability of the watershed before any additional sea level rise increment is applied. As bay water levels rise, the hydraulic gradient that allows Novato Creek to drain will diminish: in effect, the creek will have less "fall" to the bay, slowing drainage and increasing backwater flooding even during moderate rain events. Caltrans, in its planning for the SR-37 corridor, has applied OPC projections that show relative sea level rise of 1.1 to 2.7 feet along the corridor by 2050 and 3.4 to 10.2 feet by 2100 relative to 2000 baseline conditions.2 Under those conditions, the lower Novato Creek watershed becomes not merely flood-prone but chronically inundated in ways that fundamentally alter the habitability and economic viability of the communities it drains.
The Sonoma-Marin Area Rail Transit (SMART) system compounds the infrastructure exposure in this corridor. SMART's Strategic Plan for fiscal years 2025 through 2030 explicitly addresses the agency's vulnerability to sea level rise and flooding along the SR-37 corridor, and the agency has identified opportunities to align future rail infrastructure more closely with the highway between Novato and Sears Point in ways that could achieve combined transportation and resilience benefits.3 Whether that alignment can be achieved, and who will pay for it, remains unresolved. The confluence of Novato Creek flooding, SR-37 inundation, and SMART rail vulnerability in a single corridor means that the lower Novato watershed is effectively a regional infrastructure chokepoint: disruption of that corridor by flooding does not merely inconvenience local residents but severs a key transportation link for commuters, freight, and emergency services across the entire North Bay. The investment required to address this chokepoint comprehensively far exceeds what any single local government can finance from its own revenues.
Within this watershed context, Bel Marin Keys occupies the most hydrologically exposed position. The community sits along the southeast end of the lower Novato Creek watershed, with its interior lagoon system connected to the creek through outflow and inflow culverts and two navigational lock structures. In normal conditions, the locks allow water levels within the lagoon to be managed independently of the creek and bay; in flood conditions, they become critical control points whose failure would allow bay and creek water to surge directly into the residential lagoon system. The community's single access road -- Bel Marin Keys Boulevard -- connects through the lower Novato Creek floodplain to the broader Novato transportation network, meaning that road flooding not only traps residents but cuts off emergency vehicle access. The convergence of tidal flood risk, creek backwater risk, infrastructure age, and access isolation at this single location makes Bel Marin Keys the most concentrated expression of the Novato watershed's compound risk profile.
Sources
- San Francisco Estuary Institute, "Novato Creek Case Study" (2017). https://www.sfei.org/sites/default/files/project/NovatoCreekCaseStudy_Final20170227.pdf
- GovMarket News, "Highway 37 Project Receives $73M State Boost to Rebuild Key Bay Area Corridor." https://govmarketnews.com/highway-37-project-receives-73m-state-boost-to-rebuild-key-bay-area-corridor/
- SMART, Strategic Plan FY 2025-2030. https://www.sonomamarintrain.org/sites/default/files/Document%20Library/SMART_StrategicPlan_FY25-30.pdf
Bel Marin Keys: The Canary in the Coal Mine
Bel Marin Keys is, in many respects, the perfect case study for the sea level rise financing problem. It is a self-contained community with a clear and documented flood risk, a specific and quantified set of infrastructure needs, an existing special district governance structure, an assessed value base large enough to generate meaningful tax increment, and a fiscal crisis acute enough that the status quo is plainly unsustainable. The community was constructed in the early 1960s by developer Jack West, who dredged approximately 2,200 acres of former tidal marsh east of Novato to create a Venice-style waterfront residential community. The dredge spoils were used to create the land on which the homes now sit, meaning that every parcel at Bel Marin Keys rests on fill placed over former bay wetlands -- the same fill-on-marsh geology that makes the community acutely susceptible to both tidal flooding and land subsidence.
The community's 702 parcels are governed by the Bel Marin Keys Community Services District (BMKCSD), a non-enterprise special district formed on June 26, 1961, with a five-member elected board. The BMKCSD maintains eight parks, four boat ramps and docks, two navigational lock systems, approximately 200 acres of interior waterways, and the levee system that constitutes the community's primary flood defense. The district's jurisdictional boundary encompasses 990 acres; its sphere of influence covers an additional 855 acres. Most critically for the flood risk analysis, every one of the 702 parcels within BMKCSD's jurisdiction is designated by FEMA as Special Flood Hazard Area Zone AE -- meaning each parcel faces at least a one percent annual probability of flooding, and mandatory flood insurance is required for any property with a federally backed mortgage. The levee system and two lock structures that protect these homes are not supplementary infrastructure; they are the sole barrier between 702 residential parcels and tidal inundation from San Pablo Bay.
The condition of that barrier infrastructure is alarming. In January 2024, during the season's king tides, water was observed rushing through large rusted-out cracks in the north lagoon lock system. The structural failure of the lock was not a hypothetical future risk; it was a visible, documented event that brought bay water directly into the lock chamber under normal (if high) tidal conditions. The north lock rebuild alone carries a current cost estimate of $4.5 million. The south lagoon levee repair and riprap restoration is estimated at $4.4 million. These two projects, which represent the district's most urgent immediate needs, total $8.9 million against a revenue stream that, even after passage of the Measure G assessment, amounts to approximately $2.5 million per year in total district income. The math is not merely difficult; it is structurally impossible without external financing.
The BMKCSD's fiscal history reveals how it arrived at this point. In fiscal year 2023-24, the district recorded total income of approximately $1.25 million against total expenses of approximately $3.24 million, producing a net operating deficit of nearly $2 million. The Measure D marine and waterways fund -- the account that covers the district's flood infrastructure -- ran a deficit of $1.7 million. Even the Measure A parks fund ran a deficit of $286,000. In March 2024, voters approved Measure G by an overwhelming margin of 79.6 percent, authorizing an annual assessment of $1,800 per parcel for 20 years, generating approximately $1.26 million annually and a total of $25.2 million over the assessment's life. This vote represents a meaningful expression of community willingness to invest in resilience, and the approval margin suggests broad recognition among residents of the existential nature of the flood risk. But Measure G's revenues, while significant, are not sufficient to address the district's capital needs at the scale and pace that the infrastructure condition requires.
The broader context of the BMK community includes a powerful natural asset: the 2,937-acre Hamilton Wetlands Restoration Project, the largest tidal wetland restoration effort in California history, which bounds the community to the south. The restoration project -- a joint effort of the State Coastal Conservancy and the U.S. Army Corps of Engineers -- has constructed a two-mile levee that is 275 feet wide and contains 1.4 million cubic yards of engineered fill, estimated to remain effective for approximately 50 years given current sea level rise projections.1 The adjacent Bel Marin Keys Unit V component of the project encompasses 1,600 acres, including 900 acres of tidal wetlands and 680 acres of non-tidal and freshwater habitat. This large-scale restoration investment directly benefits BMK by providing natural flood attenuation and wave energy dissipation on the community's southern exposure. It also establishes an existing partnership infrastructure between federal, state, and local entities that an EIFD financing strategy could leverage.
The Foster City precedent offers a template for what successful community action looks like when levee failure threatens to trigger cascading financial consequences. In 2014, FEMA found 85 percent of Foster City's bayfront levee system to be deficient. Without repairs, the city faced FEMA redesignation that would have imposed mandatory flood insurance costs of $2,000 to $3,000 or more per household annually. In 2018, voters approved Measure P by approximately 81 percent support, authorizing $90 million in general obligation bonds for levee reconstruction. The bond levy amounts to roughly $275 per year per average homeowner -- approximately one-tenth the annual cost of the flood insurance that would have been imposed without the infrastructure investment. Construction was completed in February 2024 and a FEMA Letter of Map Revision was submitted. The Foster City case demonstrates that when the alternative cost (insurance) is clearly communicated and the infrastructure investment is properly designed and governed, communities will support the capital investment required. Bel Marin Keys shares this structure: the alternative to investment is not simply higher insurance premiums but the potential for FEMA redesignation, mandatory insurance, and a market-driven decline in property values that would erode the very tax base from which any future investment would need to be funded.
Sources
- Forgen, "Bel Marin Levee Construction" (project portfolio). https://forgen.com/portfolio/bel-marin-levee-construction/
- U.S. Army Corps of Engineers, "Bel Marin Keys Unit V Construction." https://www.spn.usace.army.mil/Missions/Projects-and-Programs/Current-Projects/Bel-Marin-Keys-Unit-V-Construction/
The Cost Spiral: Insurance, Property Values, and Tax Base Erosion
The financial consequences of sea level rise do not wait for physical inundation to materialize. They arrive first through the insurance market, which operates as a forward-looking pricing mechanism for physical risk. As the actuarial reality of coastal flood exposure has become clearer -- driven by better risk modeling, FEMA's Risk Rating 2.0 reform, and the lived experience of repeated billion-dollar flood events -- the insurance market has begun to price that risk honestly for the first time. The result is a cost spiral that is compressing homeowner budgets, discouraging transactions, and beginning to suppress property values in the most exposed communities -- precisely the communities, like Bel Marin Keys, that most need strong property values to generate the tax increment that would finance resilience infrastructure.
FEMA's Risk Rating 2.0, implemented in October 2021, replaced a decades-old premium structure that had systematically underpriced flood risk by tying premiums to flood zone categories rather than to property-specific risk characteristics. Under Risk Rating 2.0, premiums reflect the individual property's elevation, distance from water, flood frequency, and cost to rebuild. For Zone AE properties at low elevation with direct bay exposure -- the exact profile of most Bel Marin Keys homes -- this means premiums significantly above the national average. Typical Zone AE flood insurance policies in high-exposure Bay Area locations are running $1,800 to $3,500 per year as of 2025.1 FEMA projects that the national average NFIP premium will roughly double from its current level of approximately $888 per year to $1,808 at full actuarial pricing. The statutory cap of 18 percent per year on premium increases means that this adjustment will play out over several years -- creating a predictable, escalating cost burden for existing policyholders even in the absence of a flood event.
The behavioral consequences of Risk Rating 2.0 have been documented in a 2025 Environmental Defense Fund study that found the reform drove declines of up to 39 percent in new NFIP policies and up to 13 percent in existing policies in high-risk areas.2 Homeowners are dropping flood insurance not because the risk has declined but because they cannot afford or are unwilling to pay the actuarially justified premium. This creates a dangerous illusion of reduced exposure in the aggregate statistics while the actual physical risk continues to grow. Less than 5 percent of California's approximately 12 million housing units currently carry flood insurance -- a coverage gap that virtually guarantees that future flood events will produce uncompensated losses on a massive scale, imposing costs on households, local governments, and state emergency response systems that no one has explicitly budgeted for.
The private insurance market's retreat from California compounds the problem. More than 34 insurance companies have paused, restricted, or exited the California homeowners insurance market in recent years, driven by wildfire losses -- but the dynamics of their departure affect coastal flood risk coverage as well, since many coastal homeowners had been accessing flood coverage through surplus lines markets or package policies that are now unavailable or dramatically more expensive. McKinsey has estimated a statewide coverage shortfall of between $1.35 and $2.00 trillion, meaning that a substantial fraction of California's total housing value has no insurance backstop against physical damage from climate-related events.3 In communities like Bel Marin Keys, where the entire community lies within a FEMA flood zone and private alternatives to NFIP coverage are already limited, the contraction of the private market narrows the options available to homeowners and increases their dependence on a federal program that is itself chronically underfunded and operationally stressed.
The connection between flood insurance costs and property values operates through well-documented mechanisms. Academic research on FEMA flood zone redesignations consistently finds that inclusion in a Special Flood Hazard Area reduces property values by 3 to 12 percent in affected communities, holding other factors constant. The imposition of mandatory flood insurance requirements at actuarially justified premiums further reduces the effective purchasing power of buyers, translating directly into lower prices that the market will support. Lenders are also beginning to price physical climate risk into their mortgage origination and securitization decisions, raising the cost of financing or, in some cases, declining to originate mortgages at all on properties in the highest-risk flood zones. The combination of these forces creates a price compression dynamic that -- if not interrupted by credible infrastructure investment and risk reduction -- will progressively erode assessed values in communities like BMK, shrinking the tax base precisely as the cost of maintaining protective infrastructure rises.
The tax base erosion risk has direct consequences for the EIFD financing strategy proposed in this paper. An EIFD captures the increment between a frozen base assessed value and the growing current assessed value within the district. If property values in the community stagnate or decline due to flood risk repricing, the increment shrinks and the district's bonding capacity contracts. This creates a policy urgency that is often underappreciated: the window for establishing an EIFD and capturing tax increment for infrastructure investment is not infinite. It is constrained by the pace of flood risk repricing in the insurance and mortgage markets. Communities that establish their financing districts early, while their assessed values are still growing and before the most severe insurance market adjustments fully materialize, will have substantially greater bonding capacity than those that wait. The case for initiating the BMK EIFD formation process in the 2026-27 county budget cycle is in part a race against the repricing clock.
| Financial Risk Factor | Current Condition | Projected Trend |
|---|---|---|
| NFIP flood insurance (Zone AE, high exposure) | $1,800-$3,500/year (2025) | Rising at up to 18%/year cap until actuarial pricing reached |
| NFIP national average premium | ~$888/year current | Projected ~$1,808 at full actuarial pricing |
| CA private insurance market | 34+ companies restricted/exited | Continued contraction; McKinsey estimates $1.35-$2T coverage shortfall |
| NFIP policy enrollment (high-risk areas) | Down 39% new, 13% existing since RR2.0 | Further decline expected as premiums rise |
| CA homes with flood insurance | Less than 5% of 12M units | Structural underinsurance persisting or worsening |
Sources
- Flood Insurance Guru, "Flood Insurance Pricing 2025." https://www.floodinsuranceguru.com/flood-insurance-pricing-2025
- Environmental Defense Fund study on Risk Rating 2.0 policy enrollment impacts (2025).
- McKinsey & Company, statewide insurance coverage shortfall analysis (California).
The Financing Solution: Enhanced Infrastructure Financing Districts
The central financing challenge of coastal resilience infrastructure is a temporal mismatch: the investments needed today are large, the revenue streams available to local governments are small and slow-growing, but the benefits of those investments -- in avoided flood damage, protected property values, maintained tax revenues, and reduced insurance costs -- will accrue over decades and are substantial. The Enhanced Infrastructure Financing District (EIFD) is a California mechanism specifically designed to bridge temporal mismatches of this kind by allowing local governments to borrow against the future growth of their own tax base. It is not a new tax; it is a commitment of a portion of future tax revenue growth to current infrastructure investment, with that commitment monetized through bond markets.
EIFDs were created by SB 628 (Beall, 2014), codified at Government Code Sections 53398.50 through 53398.88. The mechanism works through tax increment financing: a base year assessed value is established for all taxable property within the district, and any increase in assessed value above that baseline generates "increment." That increment -- effectively the additional property tax revenue that would not exist but for the district's formation -- is directed to the EIFD rather than to the general funds of the participating taxing entities. The EIFD can then issue bonds backed by the pledge of future increment revenue, bringing forward capital that would otherwise take decades to accumulate through ordinary budgetary processes. AB 116 (2019) eliminated the prior requirement for voter approval of EIFD bond issuances, making the tool substantially more accessible to local governments that cannot confidently predict the outcome of a general obligation bond election. The district's maximum lifespan is 45 years, providing a long enough time horizon for meaningful infrastructure financing.
The EIFD statute explicitly authorizes the kinds of infrastructure most relevant to coastal resilience. Government Code Section 53398.52(b)(4) authorizes flood control levees and dams as eligible project types. Government Code Section 53398.52(b)(17), added by AB 733 (Berman, 2017), authorizes "projects to adapt to the impacts of climate change" as a separate eligible category.1 Together, these provisions create a clear statutory pathway for using EIFD financing to fund levee reconstruction, lock replacement, habitat integration, and related resilience infrastructure at Bel Marin Keys. The legislative intent behind the climate adaptation provision was precisely to enable local governments to address the kind of infrastructure gap that BMK faces: large capital needs, multi-decade useful lives, and benefits that accrue broadly across a defined geographic area and its associated tax base.
An important structural feature of the EIFD mechanism is that it does not require all taxing entities within the district's geography to participate. Participating entities agree to direct their share of the tax increment to the district; non-participating entities continue to receive their proportional share of the growing assessed value. For the BMK EIFD, the County of Marin is the essential initiating entity because, under current law, only a city or county can form an EIFD -- a special district like the BMKCSD cannot initiate formation on its own. This places the County of Marin in a strategic pivotal role: its decision to initiate feasibility study and, eventually, district formation is a necessary precondition for the financing solution described in this paper. The county's own fiscal interest in avoiding property value erosion at BMK -- which would reduce county property tax revenues, school funding allocations, and other tax base-dependent revenues -- is aligned with the interest in forming the district. The county is not being asked to be altruistic; it is being asked to recognize that the cost of EIFD formation is trivial compared to the cost of the tax base loss that would result from unaddressed flood infrastructure failure.
The EIFD model also creates a useful framework for aggregating multiple funding sources into a coherent capital program. Bond proceeds, state grants, federal cost-share contributions, and local assessment revenues can all be coordinated within the EIFD project area, with the EIFD bonds serving as the large-capital financing backstop that allows the program to proceed on a schedule driven by engineering need rather than by the timing of grant cycles. This is particularly important for a community like BMK, where the infrastructure needs are known, the engineering designs can be advanced relatively quickly, but the capital required substantially exceeds what any single funding source can provide. The EIFD is not a replacement for federal Army Corps participation or state grants; it is the instrument that makes those other sources function together as a coherent program rather than a disconnected series of partial investments.
Sources
- California Government Code Sections 53398.50-53398.88 (SB 628, 2014; AB 116, 2019; AB 733, 2017). https://leginfo.legislature.ca.gov/faces/codes_displaySection.xhtml?lawCode=GOV§ionNum=53398.52
The West Sacramento Precedent
For most of its existence since 2014, the EIFD statute was widely described as a promising but untested financing tool -- a vehicle for which the statutory plumbing had been built but which no California jurisdiction had driven to the point of actual bond issuance. That changed on July 10, 2025, when the West Sacramento Community Facilities District EIFD issued $57.225 million in Tax Increment Bonds, becoming the first EIFD in the state to complete a bond transaction and proving that the mechanism is operationally viable and that capital markets are willing to engage with EIFD-backed securities at meaningful scale. For the proponents of an EIFD-based financing strategy at Bel Marin Keys, this precedent is not merely encouraging -- it is transformative, because it eliminates the "first mover" risk that had previously made potential county sponsors cautious about investing the political and administrative capital required to form a district.
The West Sacramento EIFD's timeline illustrates both the potential and the patience required by the mechanism. From establishment to bond issuance, the process took approximately nine years. The district was formed in the mid-2010s in a rapidly appreciating real estate market, and assessed values within the district grew at an average annual rate of approximately 7.3 percent over the intervening years. The EIFD's financial model projects approximately $3.1 billion in total tax increment revenue over its 45-year lifespan, from which the $57.225 million initial bond issuance represents only a small fraction -- leaving substantial future bonding capacity as assessed values continue to grow. The bond proceeds are being used for infrastructure investments that support the district's broader development objectives, demonstrating the mechanism's effectiveness as a capital formation tool for long-duration civic infrastructure programs.
The West Sacramento experience yields several operational lessons for the proposed BMK EIFD. First, the quality of the assessed value growth narrative matters enormously for bond market reception. West Sacramento benefited from strong regional appreciation trends and a credible development pipeline within the district. The BMK EIFD will need to articulate a comparable narrative -- one grounded in the argument that infrastructure investment protects and enables assessed value growth, rather than merely consuming a share of values that would otherwise accrue to general fund recipients. Second, the nine-year timeline from establishment to bond issuance underscores that EIFD formation is a medium-term strategy, not an emergency response. The BMK community's immediate capital needs -- the north lock reconstruction at $4.5 million, the south levee repair at $4.4 million -- cannot wait nine years. Those investments will need to be financed through other mechanisms (Measure G reserves, emergency state grants, emergency FEMA Hazard Mitigation funding) while the EIFD formation process runs its course and the increment base matures. The EIFD is the medium-to-long-term capital solution that addresses the community's multi-decade infrastructure needs; it is not the answer to the immediate crisis.
Third, and most importantly, the West Sacramento precedent demonstrates that the legal uncertainties that once surrounded the EIFD mechanism have been resolved in practice. County counsels and bond counsel who were previously reluctant to invest in EIFD formation work now have a completed transaction to point to as evidence that the legal architecture is sound, the financial mechanics work, and the bond market will perform. For the County of Marin, which would need its own counsel to sign off on EIFD formation documents, this resolution of legal uncertainty substantially reduces the institutional risk of proceeding. The path from feasibility study to district formation to bond issuance is now documented, tested, and available as a template. The question for Marin County is no longer whether the mechanism works but whether the county has the institutional will to initiate the multi-year process required to deploy it.
"West Sacramento's July 2025 bond issuance proved that the EIFD mechanism is operationally viable and that capital markets will engage with EIFD-backed securities. The question for Marin County is no longer whether the tool works -- it is whether the county has the will to use it."
Sources
- West Sacramento EIFD, Tax Increment Bond issuance documentation, July 10, 2025.
- California Government Code, EIFD provisions (SB 628, 2014; AB 116, 2019).
A Proposed Pilot: The BMK Resilience EIFD
The proposed Bel Marin Keys Resilience Enhanced Infrastructure Financing District would be formed by the County of Marin, with the Bel Marin Keys Community Services District as the primary operating partner and infrastructure owner. The district boundary would encompass the 702 taxable parcels within BMKCSD's jurisdictional area, with the assessed value base established at the time of district formation. Based on the community's aggregate assessed value of $465 million to $650 million (reflecting the range from long-held Prop 13-basis assessments to recent market transactions), and assuming a conservative annual appreciation rate of 4 to 6 percent reflecting ongoing market interest in waterfront properties combined with incremental risk discounting from flood concerns, the district could reasonably project 10-year cumulative increment sufficient to support an initial bond issuance of $20 to $40 million, depending on the timing and structure of the transaction.
The capital program that BMK EIFD bonds would finance falls into three priority tiers. The first tier -- representing immediate critical needs -- consists of the north lock reconstruction ($4.5 million) and the south lagoon levee repair and riprap ($4.4 million), totaling approximately $8.9 million. These projects address the most acute failure risks in the existing infrastructure and should be funded through a combination of emergency mechanisms while the EIFD formation process proceeds. The second tier consists of comprehensive levee condition assessment and upgrade to OPC 2024 sea level rise standards, lock system replacement with modern flood gate technology, and road elevation improvements on Bel Marin Keys Boulevard at the most flood-vulnerable segments. The third tier involves longer-duration habitat integration and managed transition planning work in coordination with the Hamilton Wetlands Restoration Project, exploring whether portions of the district's perimeter can be transitioned to living shoreline configurations that provide greater long-term resilience than hard armoring at lower life-cycle cost.
The funding stack for the BMK Resilience EIFD program, when fully assembled, could reach $60 to $100 million in total available capital over the 20-year active investment phase. EIFD Tax Increment Bonds would provide the largest single increment at an estimated $20 to $40 million. Measure G revenues would contribute approximately $25.2 million over the assessment's 20-year life. The San Francisco Bay Restoration Authority's Measure AA program could provide $3 to $10 million in matching grants for habitat and shoreline restoration components. Proposition 4's coastal resilience allocation could yield $5 to $15 million, subject to competitive grant processes. The State Coastal Conservancy, which already has a long-standing relationship with the adjacent Hamilton Wetlands project, could provide $2 to $5 million for planning and design. Army Corps of Engineers cost-sharing under a formal project authorization -- at the standard 65/35 federal-local split -- could provide the most substantial single contribution if a formal partnership agreement can be established. FEMA's Building Resilient Infrastructure and Communities (BRIC) and Hazard Mitigation grant programs represent an additional $1 to $5 million in potential support.
The revenue model for the EIFD's increment generation deserves close examination, because Bel Marin Keys' Proposition 13 basis adds both a complication and an opportunity that distinguishes it from more rapidly turning-over urban markets. Under Proposition 13, assessed values for individual properties are reset to market value only upon sale or change of ownership. Long-held properties may be assessed at values established decades ago -- in some cases as low as $400,000 for homes with current market values approaching $1.4 million. This means that the EIFD's increment will accrue relatively slowly from the existing long-held inventory but will accelerate significantly with each sale. At a turnover rate of 5 to 10 percent per year (35 to 70 sales annually from a 702-parcel community), the reassessment events will generate meaningful increment growth. The long EIFD lifespan of 45 years is specifically designed to accommodate the patient increment accumulation characteristic of Prop 13 markets: the district does not need rapid turnover to generate substantial total increment; it needs a long enough time horizon for the ordinary pace of property transactions to progressively realign assessed values with market values.
Formation of the BMK Resilience EIFD requires a county initiation, a legally required infrastructure financing plan, public hearing and adoption process, and the establishment of the base year assessed value. None of these steps is technically complex, but each requires institutional commitment and administrative resources from the county. The most important first step -- and the one on which all subsequent progress depends -- is a formal County of Marin Board of Supervisors decision to include an EIFD feasibility study in the 2026-27 budget cycle. Such a study, costing an estimated $150,000 to $250,000 in consultant fees, would evaluate the increment potential, identify the appropriate district boundary, assess legal considerations, and produce a draft infrastructure financing plan suitable for public hearing. This investment is modest relative to the financing it would unlock and represents a negligible fraction of the $17 billion total county adaptation cost. Prioritizing it in the current budget cycle is the single most important near-term action available to the county to advance the BMK financing solution.
| Funding Source | Estimated Range | Notes |
|---|---|---|
| BMK EIFD Tax Increment Bonds | $20-40 million | Core instrument; requires county initiation; 45-year district lifespan |
| Measure G (parcel assessment) | $25.2 million | $1,800/parcel/year for 20 years; 79.6% voter approval secured |
| SF Bay Restoration Authority (Measure AA) | $3-10 million | $12/parcel/year across 9 counties; competitive grant process |
| Proposition 4 (2024 Climate Bond) | $5-15 million | Coastal resilience allocation; competitive; 40% for disadvantaged communities |
| State Coastal Conservancy | $2-5 million | Planning/design phase; established relationship via Hamilton Wetlands |
| Army Corps of Engineers (65/35) | Significant (TBD) | Requires formal project authorization; WRDA 2024 provides pathway |
| FEMA BRIC / Hazard Mitigation | $1-5 million | Competitive federal grant; flood mitigation eligible use |
| Total Potential | $56-100 million | Over 20-year active investment phase |
Sources
- California Government Code Sections 53398.50-53398.88 (EIFD statute).
- BMKCSD financial records, FY 2023-24.
- MTC/ABAG/BCDC Sea Level Rise Adaptation Funding and Investment Framework (2023). https://mtc.ca.gov/sites/default/files/documents/2023-07/SLR_Framework_Final_Report.pdf
Recommendations
The analysis in this paper points to a specific and time-sensitive set of actions by three principal actors: the County of Marin, the Bel Marin Keys Community Services District, and the California Legislature. The recommendations below are sequenced by urgency and by the institutional capacity required to execute them. They reflect a central conviction of this paper: the window for action is open, the financial tools exist, the physical evidence is unambiguous, and the primary constraint is not resources or legal authority but the organizational will to begin the multi-year process that the situation requires.
For the County of Marin
The county occupies the pivotal institutional role in the BMK financing solution because only the county (or a city) can initiate EIFD formation under current California law. The county also has the most to lose from unaddressed flood infrastructure failure at BMK: the erosion of the community's assessed value base would reduce county property tax revenues, school funding distributions, and the revenue of every other taxing entity that draws from the property tax roll. The following actions are recommended for the county.
-
1Initiate an EIFD feasibility study in the 2026-27 budget cycle. A consultant study costing $150,000 to $250,000 would evaluate the increment potential of the BMK parcel base, identify the appropriate district boundary, assess legal considerations, and produce a draft infrastructure financing plan. This is the single most important near-term action available to the county and the necessary precondition for all subsequent progress.
-
2Convene a multi-agency working group consisting of representatives from BMKCSD, Marin County Flood Control Zone 1, the County Assessor's office, County Counsel, and the Community Development Agency. This working group should be charged with developing the infrastructure financing plan and coordinating the BMK EIFD formation process. Establishing clear inter-agency roles and responsibilities in advance of the formal formation process will reduce delays and prevent the jurisdictional ambiguities that have stalled similar efforts in other counties.
-
3Include the BMK levee system and lower Novato Creek baylands in the county's Subregional Shoreline Adaptation Plan submitted to BCDC pursuant to the January 1, 2034, deadline under SB 272. The subregional plan should treat the BMK EIFD as the primary financing vehicle for levee and lock capital improvements, and should establish clear performance metrics for the district's infrastructure investment program that align with BCDC's regional adaptation standards.
-
4Apply to the State Coastal Conservancy for planning-phase funding to support the EIFD feasibility study and the development of the infrastructure financing plan. The Conservancy has an established relationship with the adjacent Hamilton Wetlands Restoration Project and has previously supported planning work in the North Bay shoreline corridor. A planning grant in the range of $200,000 to $500,000 could substantially offset the county's own investment in the feasibility process.
For the BMKCSD
While the county holds the key to EIFD formation, the BMKCSD is the operational center of BMK's flood infrastructure management and the entity that will implement the capital program once financing is secured. The district's credibility as a capable infrastructure owner and operator will be critical to the county's willingness to initiate EIFD formation and to bond market confidence in the security of future increment-backed bonds. The following actions will strengthen that credibility and advance the district's immediate infrastructure needs.
-
5Commission a comprehensive levee and lock condition assessment using current OPC 2024 sea level rise projections as the design standard. The assessment should produce engineering cost estimates for both immediate repairs (Tier 1) and the longer-term capital improvement program (Tiers 2 and 3) described in Section X. This assessment will serve as the technical foundation for the EIFD infrastructure financing plan, for FEMA Hazard Mitigation grant applications, and for Army Corps of Engineers project authorization requests. Without it, the financing program cannot be properly scoped or credibly presented to county, state, and federal partners.
-
6Formalize a partnership with Marin Audubon Society and County Parks to explore habitat restoration integration on the district's perimeter, particularly along the segments adjacent to the Hamilton Wetlands Restoration Project. A formal partnership agreement would strengthen grant applications to the State Coastal Conservancy and the San Francisco Bay Restoration Authority by demonstrating co-sponsorship from established conservation organizations. It would also begin the technical work needed to evaluate whether living shoreline approaches can be incorporated into the longer-term capital improvement program in ways that reduce life-cycle costs while delivering habitat co-benefits.
-
7Engage the San Francisco Bay Restoration Authority for Measure AA pre-application technical assistance. The Authority provides pre-application support to help potential grantees develop competitive applications, and BMKCSD's combination of tidal habitat adjacency (Hamilton Wetlands), documented flood infrastructure need, and Zone AE flood exposure positions it as a strong candidate for Measure AA funding. Early engagement will help the district understand the eligibility requirements, develop the technical documentation needed for a competitive application, and time the grant application to coincide with the project readiness milestones achieved through the leverage process described above.
For the California Legislature
The current EIFD statute's requirement that only a city or county can initiate district formation creates a structural barrier to deployment of the tool in the many California communities where the infrastructure need is located within a special district's jurisdiction and where the special district -- rather than the county -- has the deepest operational knowledge, the most direct community relationships, and the clearest fiscal interest in securing resilience financing. Amending the statute to allow special districts to initiate EIFDs for climate adaptation purposes -- with appropriate oversight and approval mechanisms -- would unlock the tool for dozens of California communities facing circumstances similar to Bel Marin Keys.
-
8Amend the EIFD statute to allow special districts to initiate Enhanced Infrastructure Financing Districts for climate adaptation projects. The amendment should establish clear procedural requirements, including county board approval for any special district-initiated EIFD, to provide an appropriate check on district authority while removing the current structural barrier. This single legislative change would substantially expand the universe of California communities able to deploy EIFD financing for coastal resilience, tidal wetland restoration, and related climate adaptation infrastructure -- all without requiring new taxes, new bond authorizations from the Legislature, or voter approval.
The recommendations above reflect a clear-eyed assessment of what is possible within existing institutional and financial constraints, not an ideal-world wish list. They do not require waiting for a federal program that may or may not materialize under the current political administration. They do not require voter approval of new taxes, though the existing 79.6 percent community support for Measure G signals that such support would likely be available if needed. They require county government to make a relatively modest investment of administrative attention and budget in a feasibility study, and they require the BMKCSD to professionalize its infrastructure planning function to the level that external financing partners can rely upon. These are achievable asks. The physical urgency of the BMK flood infrastructure situation, the mathematical impossibility of meeting that urgency from existing revenue streams alone, and the availability of a proven financing tool through the EIFD mechanism together constitute a compelling case for action that the county, the district, and the state should find impossible to responsibly defer.
Sources
- California Government Code Sections 53398.50-53398.88 (EIFD statute). https://leginfo.legislature.ca.gov/faces/codes_displaySection.xhtml?lawCode=GOV§ionNum=53398.52
- BCDC, Regional Shoreline Adaptation Plan (December 2024). https://www.kqed.org/news/12016813/bay-area-now-has-first-ever-regional-sea-level-rise-plan
- City of Novato, Flood Information and CRS data. https://www.novato.gov/community/flood-information/flood-insurance
Rising Tides, Sinking Ground
Prepared by Marc Hunter Lewis | March 2026
This paper draws on publicly available research, government reports, and regulatory filings. All source URLs are cited inline throughout the document. The funding models and projections presented are analytical estimates intended to support policy planning and do not constitute financial advice or official government projections.